London Bike Rides
Tableau

Github: London-bike-sharing
Tableau Public: London Bike Usage
This project involves cleaning, transforming, and preparing the London bike-sharing dataset for visualization and analysis. Key steps include:
- Data Extraction: Extracted and loaded
london_merged.csvfrom a ZIP file. - Data Cleaning: Renamed columns for clarity, normalized humidity values, and mapped encoded values for seasons and weather to readable labels.
- Data Preparation: Transformed and saved the cleaned dataset as an Excel file (
london_bikes_final.xlsx) for Tableau visualizations.
The analysis explores bike usage patterns based on weather, seasons, and other factors, enabling deeper insights into trends.
Volstock project
Python, SQL, AWS, Power BI
Github: Volstock-project

A data pipeline was developed to extract data from a live operational database, transform it into a star schema, and load it into a data warehouse on AWS.
Key features include:
- Automated workflows for data ingestion, transformation, and loading.
- Real-time updates to the warehouse within 30 minutes.
- Secure and monitored processes with logging via AWS CloudWatch and email alerts for failures.
- A BI dashboard to visualize insights from the warehouse.
The project highlights the use of Python, SQL, AWS, and data modelling to create a reliable and automated data platform.
Electric Vehicle Analysis
PostgreSQL, Python
Github: Electric-Vehicle-Population-Data

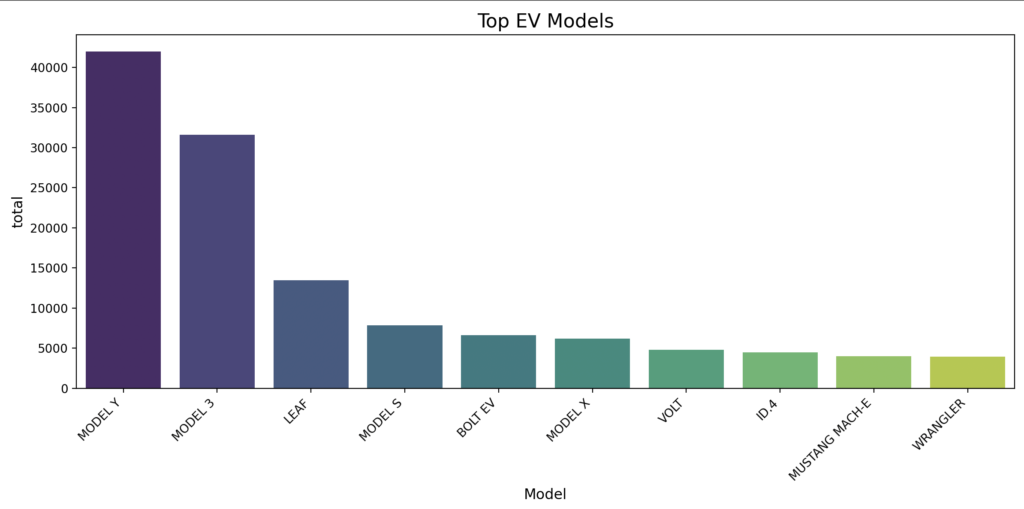
This project analyses electric vehicle (EV) population data using Python and PostgreSQL. The dataset includes details on EV manufacturers, models, ranges, and geographical distribution.
Key analyses include:
- Manufacturer trends: Identifying the top EV manufacturers and their market share.
- Range comparisons: Calculating average ranges for different vehicle types like BEVs and PHEVs.
- Regional insights: Examining the distribution of EVs across counties.
- Policy alignment: Analysing EV eligibility for clean alternative fuel programs.
The findings are visualised using Python libraries such as Matplotlib and Seaborn, and all insights are stored in a PostgreSQL database for efficient querying and reporting.
Optimising the EVolution
Power BI, Excel
Github: Optimising-the-EVolution

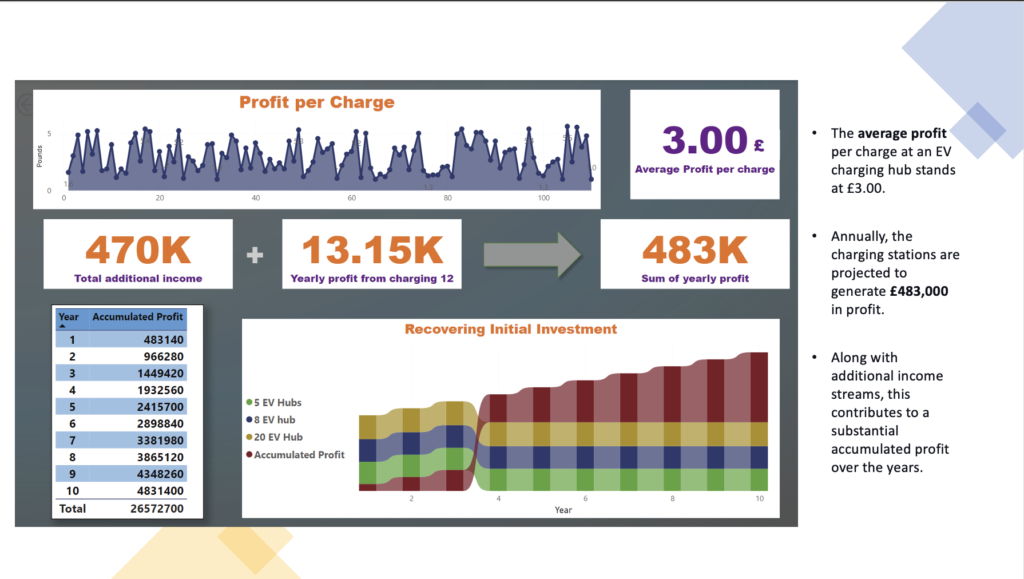
This project evaluated the feasibility of establishing an electric vehicle (EV) forecourt, comparing a holiday destination with a motorway. The analysis focused on forecasting EV demand, estimating daily customer volumes, optimising charger capacity to balance efficiency and cost, and calculating ROI to determine the payback period. The findings provide a data-driven foundation for strategic investment in EV charging hubs, supporting the growing demand for sustainable infrastructure.
